The real pain today
Value is a matter of opinion. The system team says it helps. Product teams say it is in the way. You cannot tell who is right.
AI makes the stakes higher. Teams now ship interface written by agents. If the system is not in their context, inconsistency grows faster than anyone can review it.
Ownership is unclear. When something goes wrong, nobody is sure who was meant to decide.
Your week with Loom
Most weeks Loom asks very little of you. That is the point.
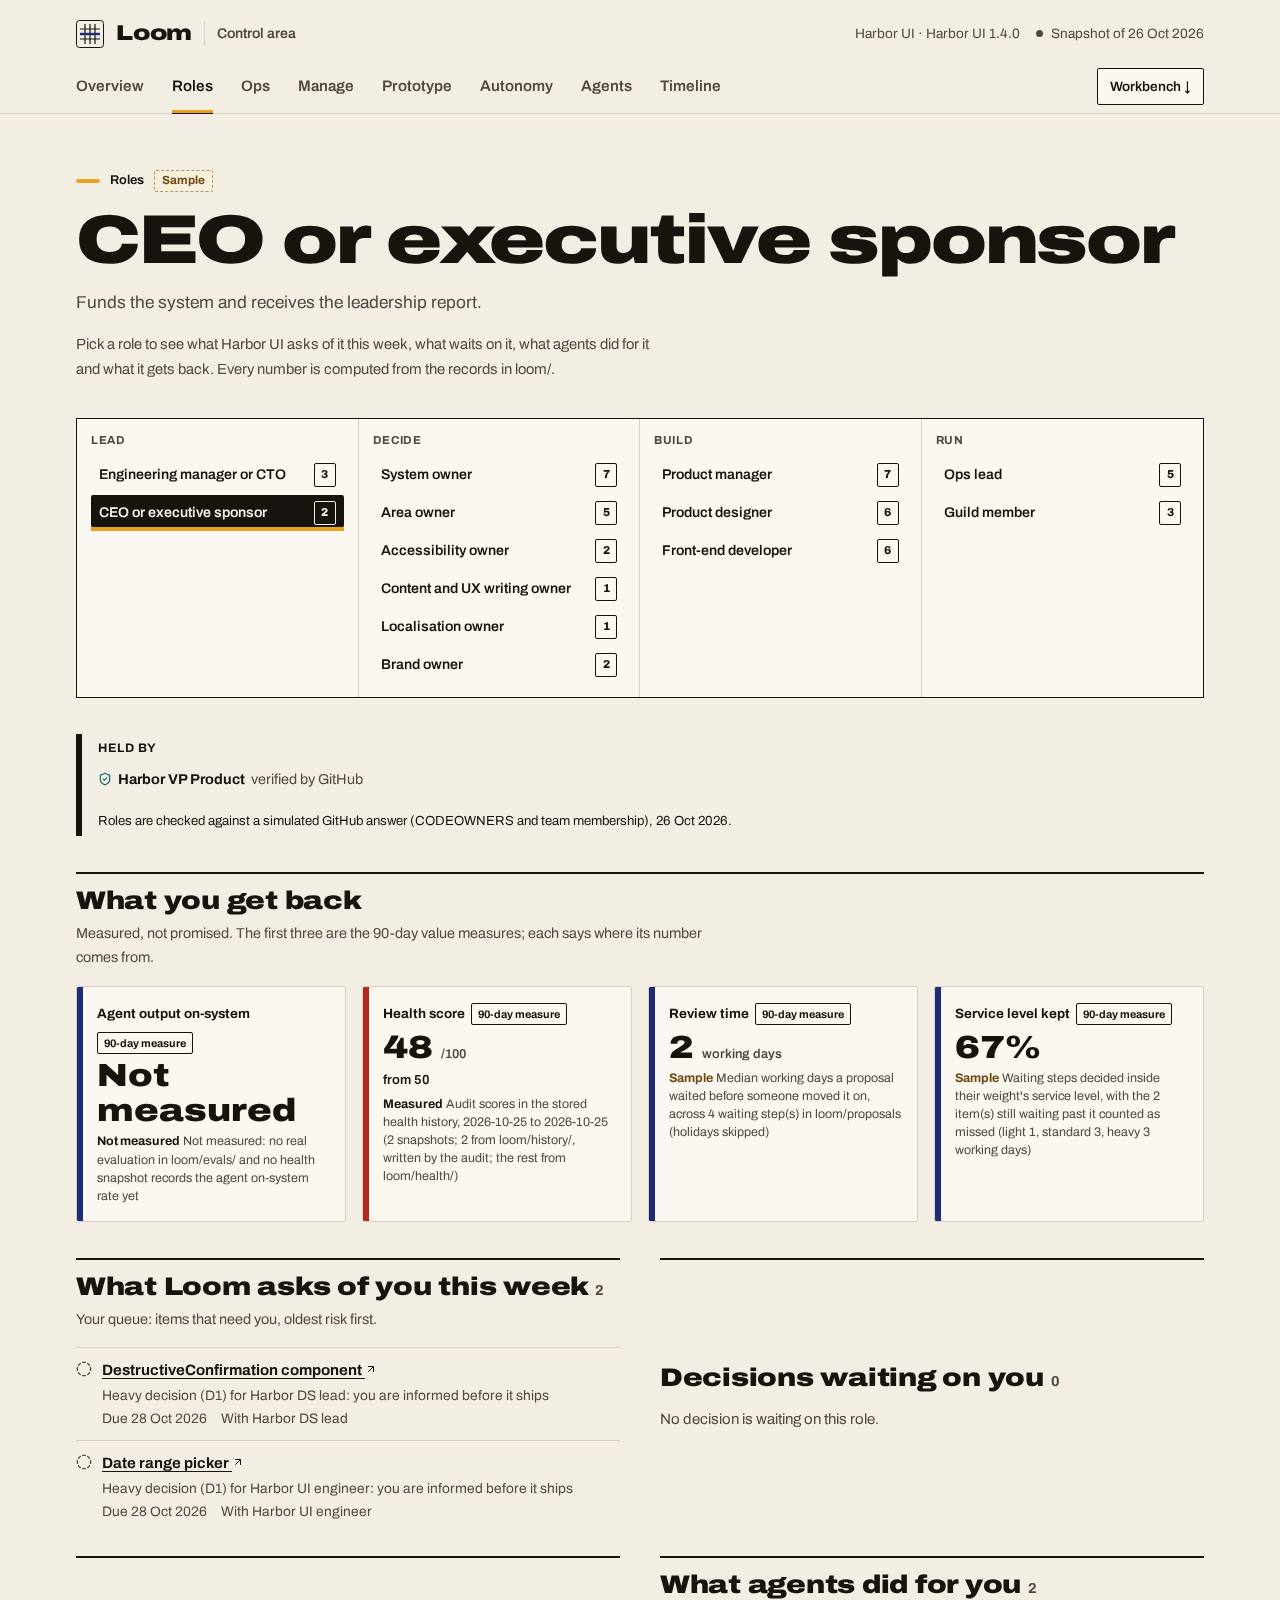
Monday. You open the read-only dashboard: a static site your own CI builds and publishes, with no Loom server involved. It shows the three measures, agent output on-system, the health trend and review time with service levels kept, plus the risks and the decisions made. Where a source is missing it says "not measured". Open the sample dashboard Your home in the control area shows the same measures. See the sponsor's home
Tuesday. Nothing waits on you unless the roles changed. In the kickoff week, you and the system owner sign off the roles and who does what; the sign-off is recorded as a governance decision, so it is clear from the first day who decides each kind of change. Read who does what
Wednesday. If a heavy decision is on its way, such as a breaking change or a new locale made required, it is listed so you are informed before it ships, not after.
Thursday. The system owner reviews the leadership report Loom drafted from the records: the stage your organisation is at, the health trend, flow and support, and the decisions leadership needs to take. See the comms centre
Friday. In the first week of the month you read the monthly report: one page in plain words, from measured data only, with a section for what is not measured yet and no savings figures. Read a sample monthly report At 90 days we judge an engagement by the three measures, against the baseline taken in week one.
The dashboard and the report are built and tested on sample records (the links open Harbor UI, a synthetic system); no sponsor has received one yet.
What changes
You get evidence instead of competing stories. Each measure on your home says where its number comes from, and anything Loom cannot measure reads "not measured" rather than a guess. In the product tour they are sample values; in your organisation they come from your own records.
What you never have to do
You never read a status deck assembled the night before. You never approve a change in the system's details: decisions belong to the people who own them, and you see the outcomes.
Coming next
The dashboard running in your own CI on your own records, from the workflow template we ship. Until a real on-system evaluation is stored, the agent measure reads "not measured", and we will say so rather than show a number.